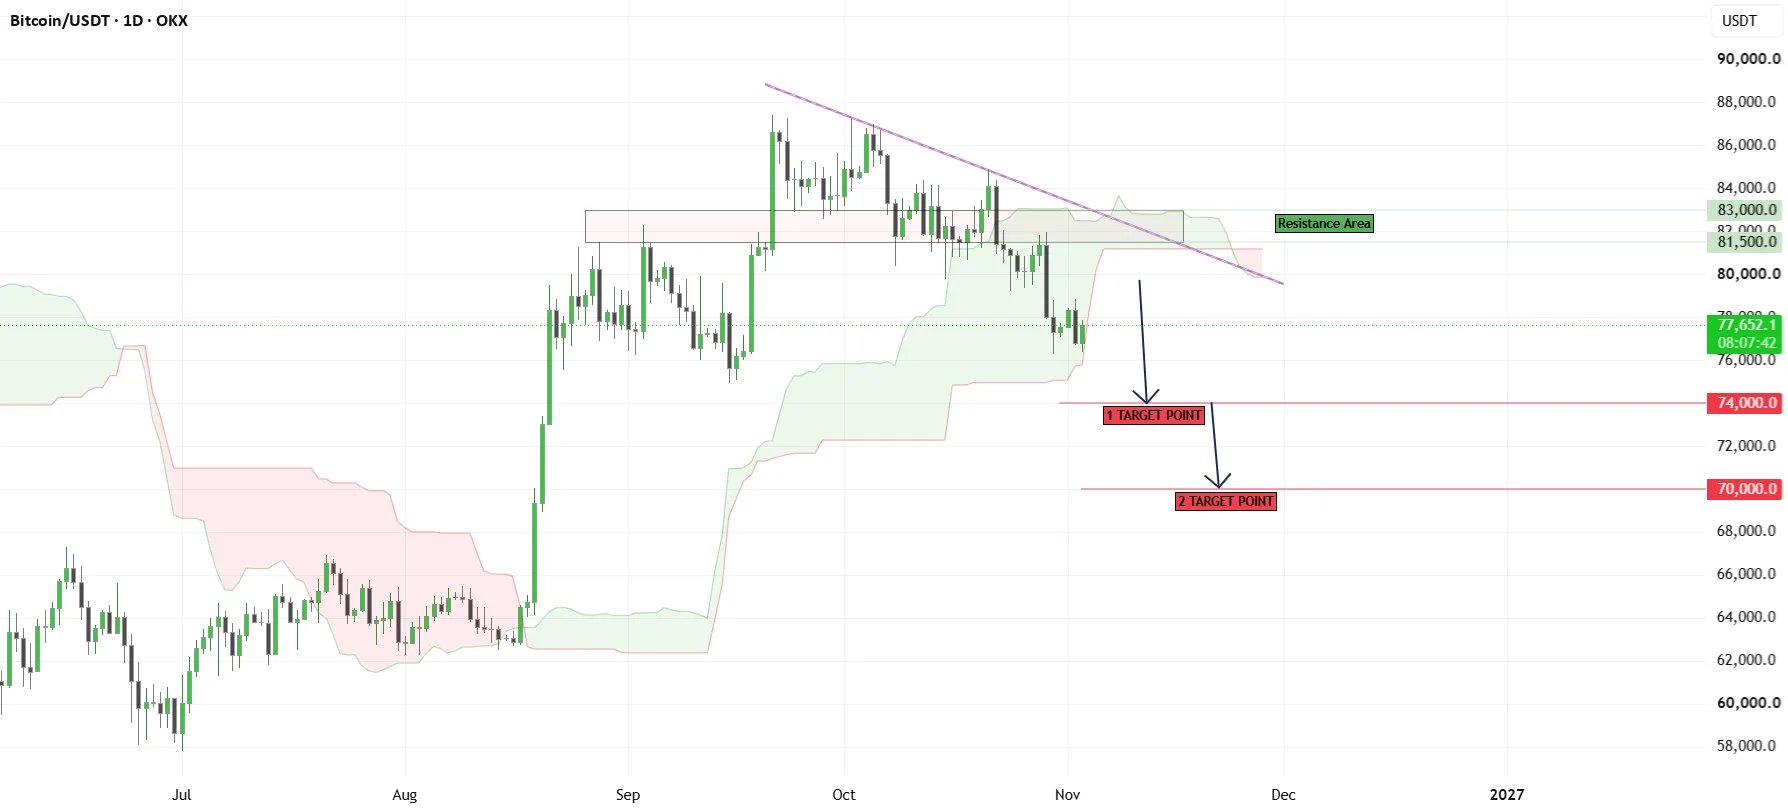
BTCUSDT is showing a bearish technical bias after slipping below a consolidation zone and breaking under a descending trendline. The most important reference point for traders is now the 81,500 resistance area, which could define whether downside momentum continues or stalls.
The setup is notable because breakdowns from compressed ranges often lead to expansion in volatility. For BTCUSDT, the market is now testing whether sellers can maintain control beneath former support and keep price capped below nearby resistance.
Market Snapshot
BTCUSDT, viewed on a short-term technical timeframe, is currently trading in a weakened structure after losing a consolidation base. The recent price action suggests that bullish attempts to stabilize have faded, while the break under the descending trendline points to a market that is struggling to reclaim upward momentum.
In plain English, the chart favors the bears unless price can recover key overhead levels. As long as BTCUSDT remains below 81,500 and especially below 83,000, the prevailing bias remains tilted toward further downside continuation rather than a sustained rebound.
Key Levels
- Support: No clearly defined support is established in the current setup, which increases the importance of monitoring how price behaves at lower intraday reaction zones.
- Resistance: 81500, 83000
These resistance levels matter because they represent likely areas where sellers may re-emerge. They also align with prior market reactions and the broader breakdown structure, making them important checkpoints for confirming whether BTCUSDT remains in a bearish phase or starts to repair its technical damage.
Bullish Scenario
Although the current bias is bearish, a bullish alternative would begin to develop if BTCUSDT reclaims 81,500 and holds above it with improving momentum. That would suggest the breakdown may be losing follow-through, especially if buyers can force price back into the prior consolidation region.
A stronger bullish signal would come from a move toward and above 83,000, which could open the door to a recovery into the next nearby supply zone. Even then, the upside case would need confirmation through sustained acceptance above resistance rather than a brief spike, as failed recoveries are common after breakdown patterns.
Bearish Scenario
The bearish case remains the primary path while BTCUSDT stays below 81,500 and cannot reclaim 83,000. If selling pressure persists, the recent break below consolidation and the descending trendline could continue to act as confirmation that the market is transitioning into another leg lower.
In that scenario, failure to recover broken structure would keep the focus on fresh downside extension into lower reaction zones, with traders watching for momentum expansion as price moves away from the breakdown area. From a technical perspective, a recovery above 83,000 would weaken the bearish thesis, making that level a practical invalidation point for the immediate downside structure.
What to Watch
Macro conditions remain important for BTCUSDT, particularly shifts in interest-rate expectations, inflation-related data, and broader risk sentiment across global markets. Crypto assets often react sharply when macro releases change expectations for liquidity and investor appetite for higher-volatility instruments.
Market participants should also watch session timing. Volatility often increases during the overlap between major European and U.S. trading hours, when liquidity deepens and directional moves can accelerate. If BTCUSDT approaches 81,500 or 83,000 during these periods, price behavior around those levels may carry more significance.
Correlation with major risk assets and sentiment indicators is another factor to monitor. Weakness in equity index futures, pressure across large-cap crypto names, or deteriorating sentiment in the broader digital-asset market could reinforce the bearish structure. On the other hand, a broad risk rebound could help BTCUSDT challenge resistance and test whether the breakdown still has momentum.
For now, BTCUSDT remains in a technically fragile position, with resistance levels shaping the near-term outlook. The next phase will likely depend on whether sellers can defend overhead supply or whether buyers can reclaim broken structure and shift sentiment.