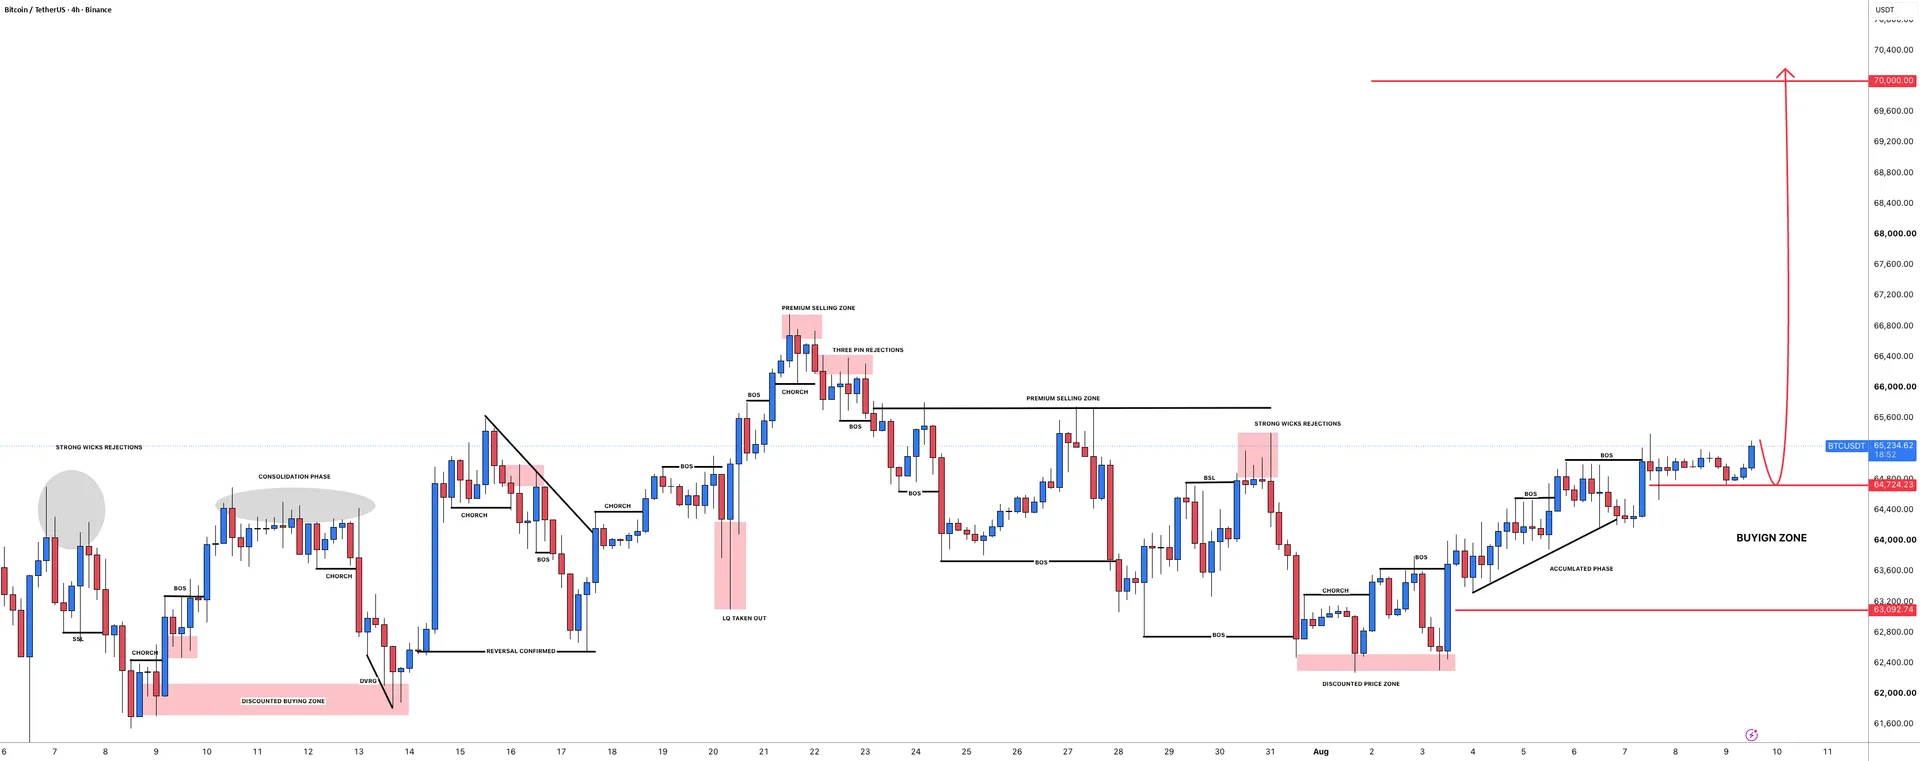
BTCUSDT is holding a bullish bias, but the market remains locked in consolidation beneath a key resistance band. The 65,500-65,800 zone stands out as the most important near-term level, with price action clustering just below it.
That setup keeps traders focused on whether Bitcoin can convert compression into continuation. A clean move through resistance could reopen the path higher, while a loss of the 60,000-62,000 demand area would weaken the recovery structure.
Market Snapshot
BTCUSDT is a crypto pair currently showing a consolidation pattern on the chart, with price moving between a clearly defined support base and overhead resistance. The broader structure still leans constructive, as buyers have so far managed to defend pullbacks instead of allowing a deeper breakdown.
In plain English, the market is pausing rather than reversing. That gives BTCUSDT a mildly bullish tone, but confirmation is still needed because the pair has not yet cleared the ceiling that would signal renewed upside momentum.
Key Levels
- Support: 60000, 62000, 57500, 64000
- Resistance: 65500, 65800
These levels matter because they define the current trading box. The 64,000 area can act as an intermediate floor inside the range, while 60,000-62,000 represents the more important demand zone that has to hold if the broader bullish structure is to remain intact. On the upside, 65,500-65,800 is the immediate decision area where prior selling pressure has limited follow-through.
Bullish Scenario
The bullish path would begin with BTCUSDT pushing decisively above the 65,500-65,800 resistance zone. A breakout from consolidation often signals that buyers are regaining control, especially if price can sustain acceptance above the range rather than quickly slipping back below it.
If that trigger is met, the next move could develop into a broader recovery leg, with the market targeting a higher extension beyond the recent cap. In that scenario, the former resistance band would become the first area to watch as potential support on any retest, reinforcing the idea that the consolidation phase has resolved upward.
Bearish Scenario
The bearish alternative comes into focus if BTCUSDT fails to preserve the 60,000-62,000 support zone. That area is central to the current bullish case, and a loss of it would suggest that buyers are no longer absorbing supply effectively.
If that breakdown occurs, the setup would be invalidated in the short term and could open the door to a move toward 57,500. Such a development would shift the structure from healthy consolidation into a deeper corrective phase, especially if rebounds remain capped beneath 64,000 after the break.
What to Watch
Macro conditions remain important for Bitcoin even when the chart structure looks self-contained. Traders will want to monitor major economic releases, central bank expectations, and shifts in rate sentiment, as these can quickly influence liquidity conditions and appetite for risk-sensitive assets such as crypto.
Session timing may also matter. Volatility often expands during the overlap between major market sessions, when both crypto-native flows and broader risk sentiment can align. If BTCUSDT approaches resistance during a high-volume period, any breakout attempt may carry more weight than a move that develops in thinner conditions.
Correlated assets and sentiment indicators are also worth tracking. Strength in major equity indices, stability in the US dollar, and broad participation across large-cap digital assets can support the bullish case. By contrast, if Bitcoin tests resistance while market breadth weakens or sentiment turns defensive, the consolidation may continue for longer before any clear directional resolution appears.
For now, BTCUSDT remains balanced between defended support and nearby resistance. The next sustained move will likely depend on whether price can break above 65,800 or loses the 60,000-62,000 demand zone.