BTCUSDT continues to carry a bullish medium-term bias, with the $50,000-$53,000 area standing out as the most important support zone on the chart. That region is central to the current setup because it may define whether the broader uptrend can reassert itself.
At the same time, resistance between $70,000 and $75,000 remains a critical barrier. If price is rejected there, BTCUSDT could revisit lower support before any renewed push toward higher long-range targets.
Market Snapshot
BTCUSDT is a crypto instrument showing a constructive broader structure, even as price action faces notable resistance overhead. The current framework suggests a market that remains bullish on a swing basis, but only if key support levels continue to absorb selling pressure.
In plain English, the chart reflects a market caught between a strong support base around $50,000 and a heavy supply zone around $70,000-$75,000. As long as BTCUSDT avoids a deeper structural breakdown below major support, the prevailing bias still favors eventual upside expansion rather than a lasting bearish reversal.
Key Levels
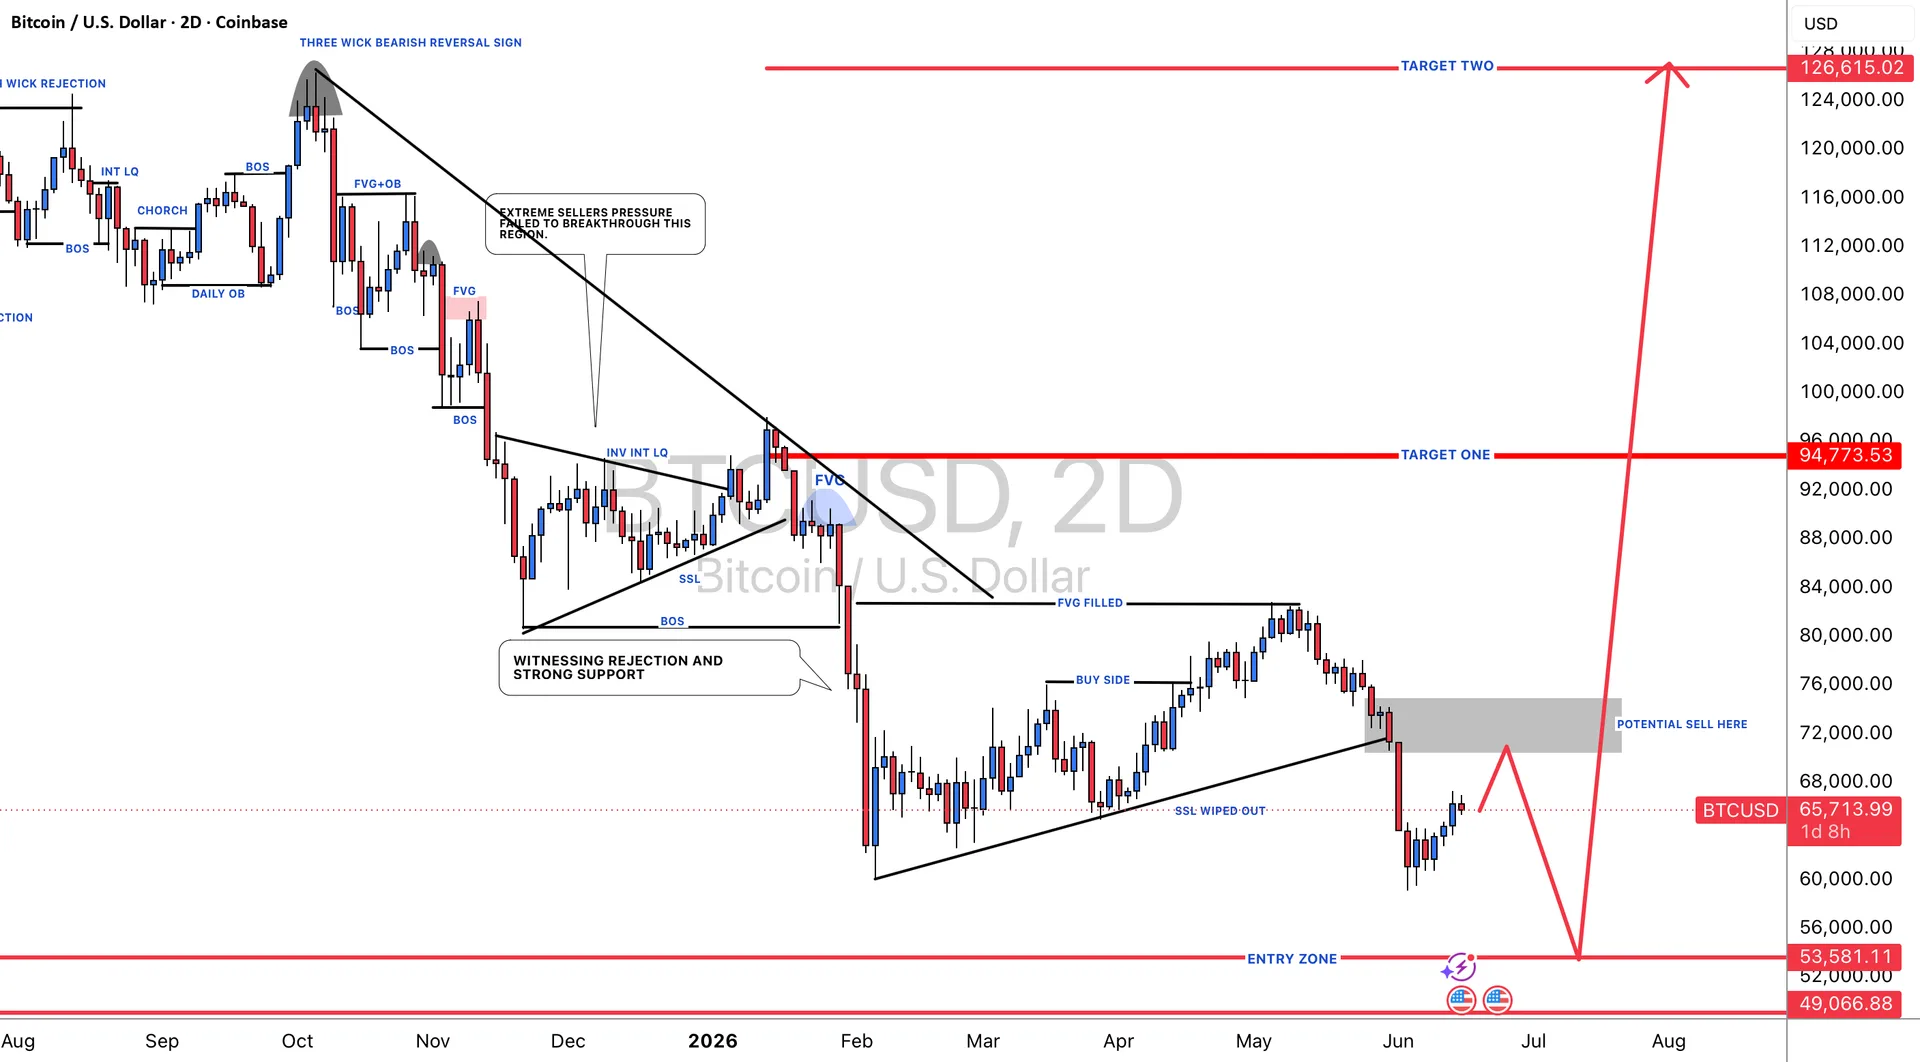
- Support: 50000, 48000
- Resistance: 70000, 75000, 92000, 124000
These levels matter because they define the most likely reaction areas for market participants. The support region near $50,000 has the character of a potential demand zone, while $70,000-$75,000 represents a visible resistance band where prior selling interest could re-emerge. Beyond that, $92,000 and $124,000 serve as longer-range upside reference points if bullish momentum strengthens and the structure remains intact.
Bullish Scenario
The bullish path centers on BTCUSDT holding the $50,000-$53,000 region and forming a stable base from which buyers can regain control. If that zone attracts renewed demand and price begins to recover with stronger momentum, the first major objective would be a return toward the $70,000-$75,000 resistance band.
A decisive move through that overhead supply area would strengthen the case for a larger continuation move. In that scenario, the next realistic target zone would be around $92,000, with $124,000 acting as an extended upside objective if trend conditions remain favorable and broader market sentiment continues to support risk assets.
Bearish Scenario
The bearish path begins with BTCUSDT failing to clear the $70,000-$75,000 resistance area and facing renewed selling pressure from that zone. If rejection develops there, the market could rotate lower and revisit the major support region around $50,000.
The key invalidation level for the broader bullish structure is near $50,000, with $48,000 acting as the next downside target if support gives way. A sustained move below that lower band would suggest that the market is no longer in a simple pullback phase and may be entering a deeper corrective leg instead.
What to Watch
Macro conditions remain important for BTCUSDT, particularly expectations around interest rates, inflation data, and overall liquidity trends. Crypto markets often respond sharply when global risk sentiment shifts, so major economic releases can influence whether Bitcoin behaves like a high-beta risk asset or shows relative strength.
Session timing also matters. Volatility can expand during periods when liquidity is concentrated, especially around the overlap between major market regions and during U.S. trading hours. Traders will likely monitor whether price reactions at support and resistance occur on rising volume, as that can help confirm whether a move has conviction or is simply a temporary spike.
Correlation and sentiment should also stay in focus. Strength or weakness in major crypto benchmarks, performance across altcoins, exchange flows, and derivatives positioning can all shape BTCUSDT’s next move. If sentiment improves while price remains above key support, the bullish case gains credibility; if sentiment deteriorates near resistance, the probability of another pullback increases.
For now, BTCUSDT remains in a technically constructive position, but the market is still defined by the battle between support near $50,000 and resistance around $70,000-$75,000. The next meaningful move will likely depend on which of those zones breaks first and how convincingly price reacts around them.