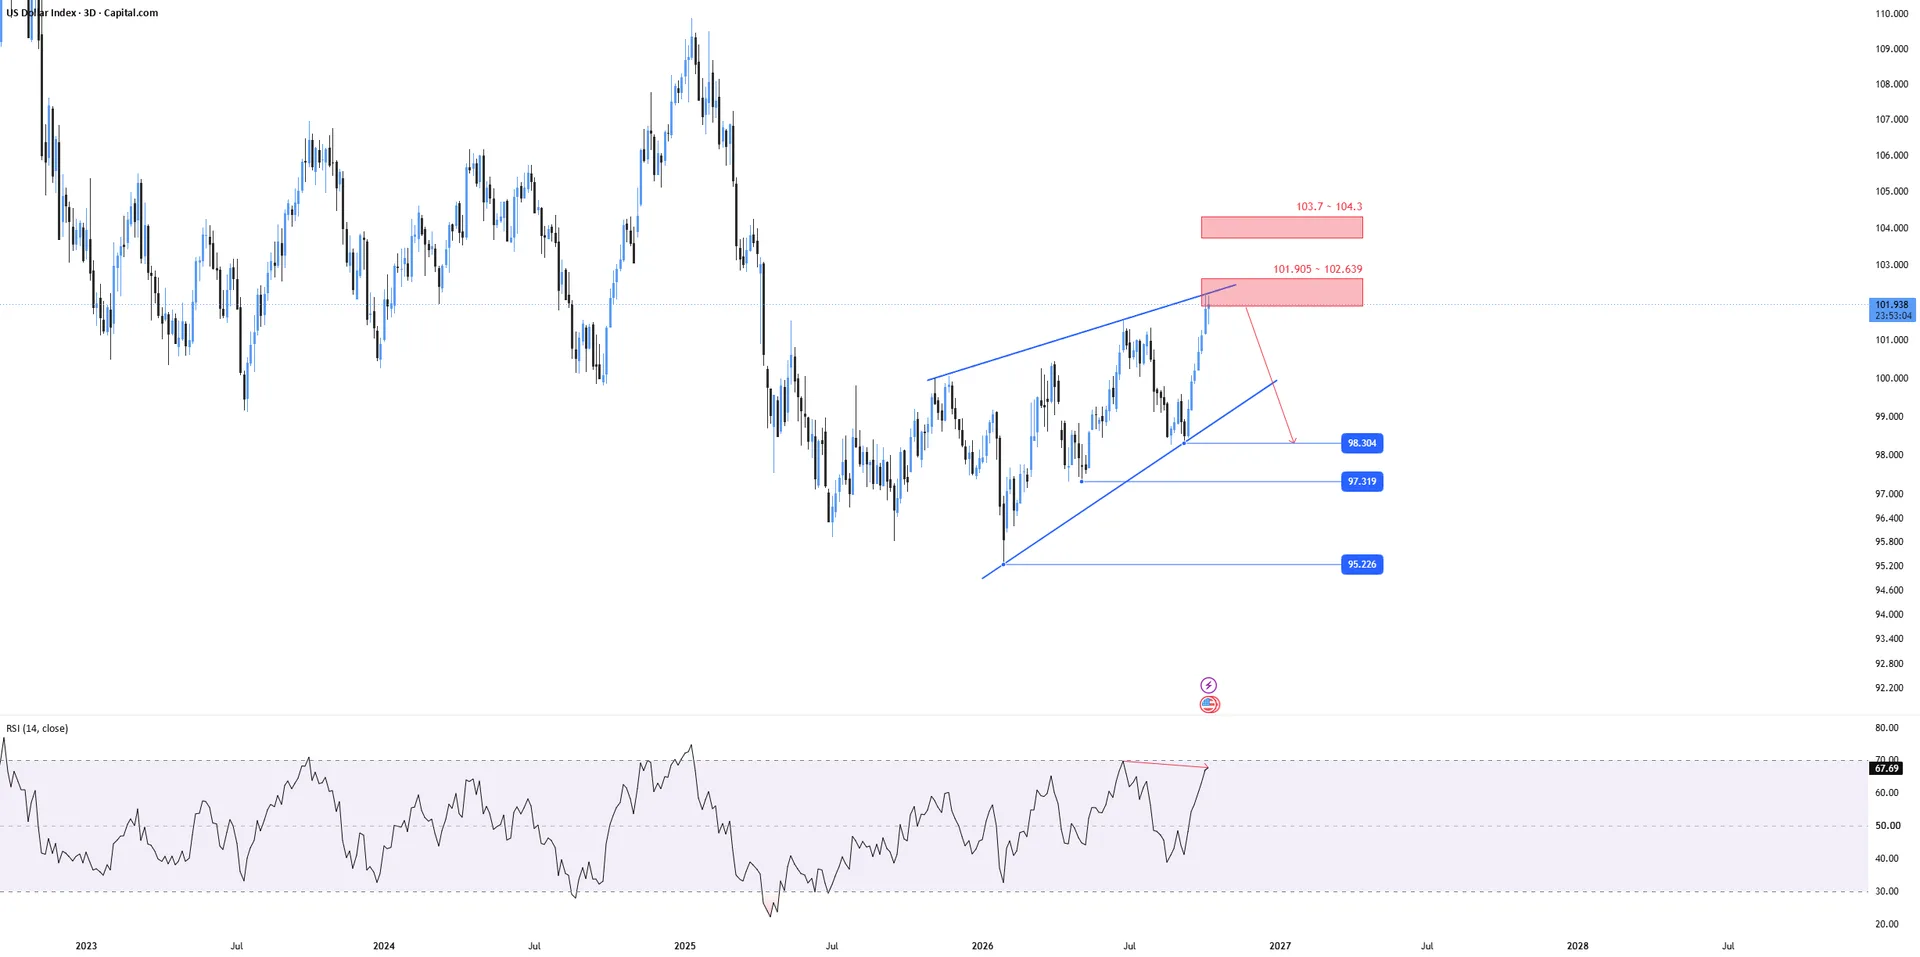
DXY is approaching a critical technical area with a bearish bias developing beneath a well-defined supply zone. The main focus is the rising wedge structure, which is often associated with weakening upside momentum when it forms into resistance.
The most important level on the chart is the 101.905-102.639 resistance band. If price is rejected from this area, the setup would strengthen the case for a downside reversal in the U.S. Dollar Index.
Market Snapshot
DXY, the U.S. Dollar Index, is being assessed through a bearish technical lens as price trades into a notable overhead resistance cluster. The current structure shows a recovery attempt unfolding inside a rising wedge, a pattern that can signal exhaustion when it develops after an upward correction.
In plain English, the market is trying to push higher, but that advance is running into an area where sellers have previously become active. As long as DXY remains capped below the upper boundary of the resistance zone, the broader near-term bias favors a pullback rather than a sustained breakout.
Key Levels
- Support: —
- Resistance: 101.905, 102.639
These resistance levels matter because they define a supply zone where price may struggle to extend the recovery. The area also aligns with the upper portion of the wedge structure, creating technical confluence that increases its importance for short-term direction.
Bullish Scenario
For the bearish setup to weaken materially, DXY would need to break decisively above 102.639. A move through that level would invalidate the immediate reversal watch and suggest that buyers have absorbed supply that had previously limited the advance.
In that case, the recovery could extend beyond the wedge and shift market attention toward a continuation phase rather than a rejection. The bullish path would likely require firm momentum and a clean hold above former resistance, turning 102.639 into a level to monitor for confirmation instead of rejection.
Bearish Scenario
The bearish case remains centered on rejection from the 101.905-102.639 resistance zone. If DXY fails to clear this band and begins to roll over, the rising wedge would take on greater significance as a potential reversal pattern, pointing to fading buying pressure at elevated levels.
The invalidation level for that bearish view is a sustained break above 102.639. Until that happens, the more realistic downside path is a move away from supply and back toward lower price territory, with the initial target zone defined by a broader retracement from the recent recovery leg rather than an immediate trend extension higher.
What to Watch
Macro catalysts remain especially important for DXY because the index is highly sensitive to interest-rate expectations and shifts in relative growth outlooks. Traders will be watching major U.S. economic releases such as inflation data, labor-market readings, and central-bank communication for clues on whether the dollar can maintain support or lose momentum near resistance.
Session timing also matters. Moves in DXY often gain traction during the London and New York sessions, when liquidity and participation are strongest. If the index tests 101.905 or 102.639 during these higher-volume windows, the market reaction may carry more weight than a quieter move outside core hours.
Correlated assets can offer additional context. Treasury yields, EURUSD, and broader risk sentiment are all worth monitoring because they often move in ways that either reinforce or challenge the dollar’s direction. If yields soften and risk appetite improves while DXY stalls under resistance, that combination could support the bearish technical view. On the other hand, renewed demand for defensive positioning could help the index press higher and challenge the reversal thesis.
DXY remains at an important technical crossroads as the rising wedge presses into overhead supply. Whether price is rejected from resistance or breaks through it should help define the next phase of short-term market structure.