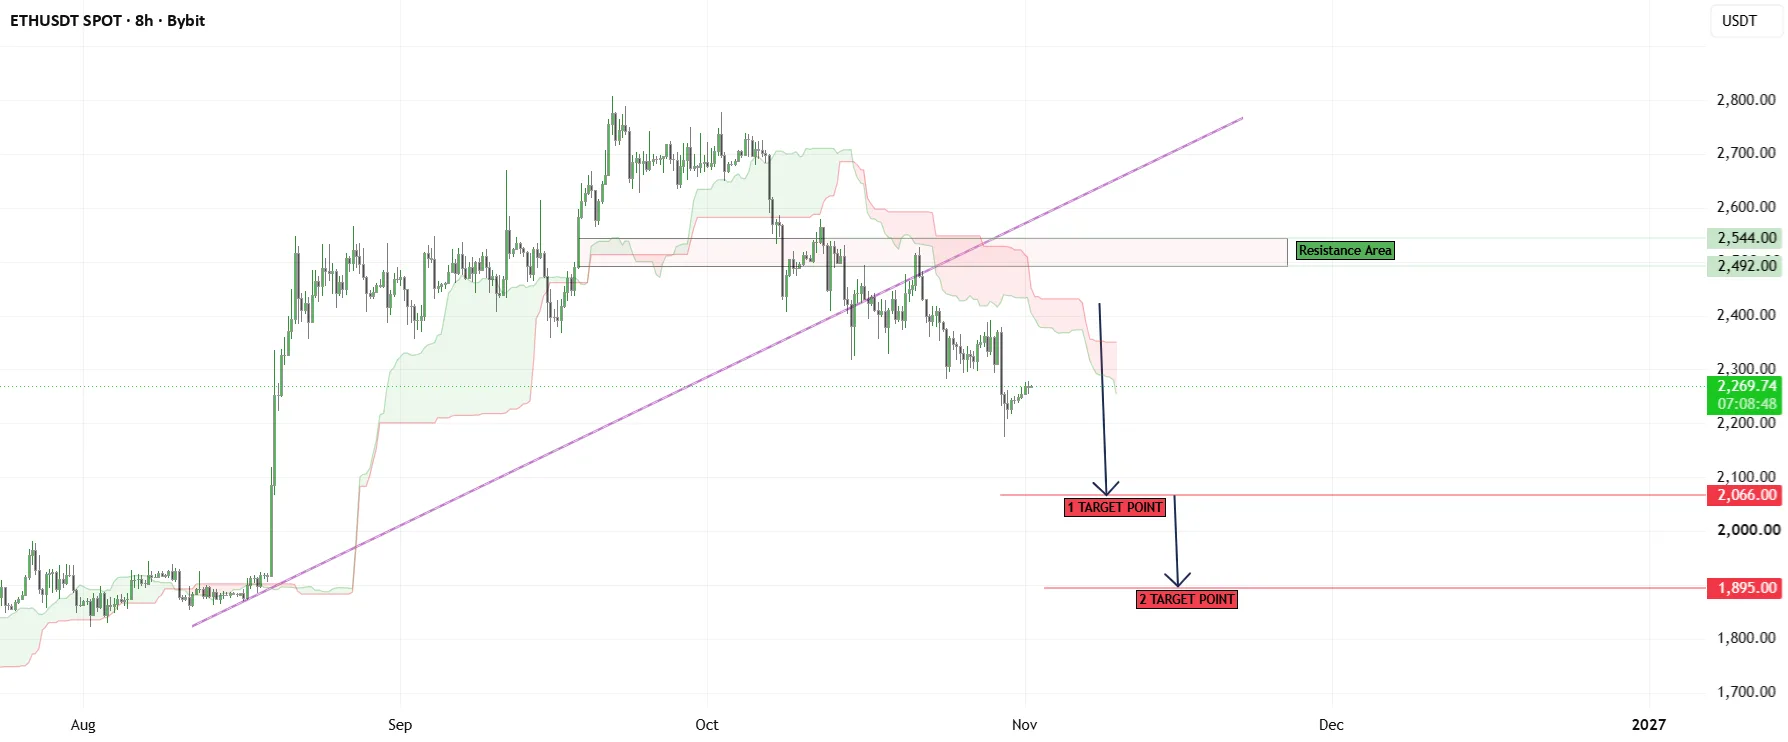
ETHUSDT is trading with a bearish bias after breaking below a key rising trendline, a technical shift that puts downside continuation in focus. The most important feature on the chart is the failed structure support, which now acts as a reference point for any recovery attempt.
As long as ETHUSDT remains below the broken trendline and under Ichimoku Cloud resistance, sellers appear to retain the near-term edge. A reclaim of that zone would weaken the bearish setup, but until then the market structure favors caution.
Market Snapshot
ETHUSDT is a cryptocurrency pair showing a weaker technical posture following a clear breakdown from trendline support. On the observed chart structure, price is no longer respecting the prior upward path, which suggests momentum has shifted away from buyers and toward a more defensive market tone.
In plain English, the setup points to a market that has lost an important floor. The prevailing bias remains bearish while price trades below the broken structure and beneath the Ichimoku Cloud, both of which reinforce the idea that rallies may face resistance unless buyers can reclaim lost ground decisively.
Key Levels
- Support: Recent swing lows below the breakdown area, which now define the first zone where buyers may attempt to slow the decline.
- Resistance: The broken trendline area and the lower boundary of the Ichimoku Cloud, which together form the main overhead barrier.
These levels matter because they represent the transition between the prior uptrend structure and the new bearish phase. The trendline breakdown is the key technical event, while cloud resistance adds confluence by marking an area where momentum and trend-following traders may look for confirmation of continued weakness.
Bullish Scenario
The bullish path would begin with ETHUSDT reclaiming the broken trendline and stabilizing back above nearby dynamic resistance from the Ichimoku Cloud. That kind of recovery would not automatically flip the entire structure bullish, but it would reduce immediate downside pressure and suggest the breakdown may be losing traction.
If buyers can push price back above that trigger zone and hold it, the next realistic objective would be a return toward the prior consolidation area that existed before the breakdown accelerated. In that case, the market would likely shift from outright bearish continuation to a more balanced recovery phase, with traders watching whether momentum can build above former resistance.
Bearish Scenario
The bearish scenario remains the base case while ETHUSDT continues to trade below the broken trendline and under cloud resistance. Failure to reclaim that area would keep the breakdown valid and maintain the current pattern of lower highs and technical rejection.
For this setup, the invalidation level is a sustained move back above the broken trendline and the nearby cloud barrier. If that does not happen, ETHUSDT could continue rotating lower toward recent swing-low territory, with the next target zone defined by previous reaction lows formed after the breakdown. A clean loss of those lows would strengthen the case for an extended downside leg.
What to Watch
Crypto traders should monitor broader market sentiment, especially moves in Bitcoin, since ETHUSDT often reacts to leadership from the largest digital asset. If Bitcoin remains under pressure, Ethereum may find it harder to reclaim resistance, while a broader crypto rebound could help soften the bearish structure.
Macro conditions also matter. Shifts in interest-rate expectations, US dollar strength, and risk appetite across equities can influence flows into higher-volatility assets such as Ethereum. A risk-off tone in traditional markets may reinforce the existing bearish setup, while improving sentiment could encourage short-covering and a test of the broken trendline.
Session timing is another important factor. Breakouts and breakdown extensions often gain traction during periods of higher liquidity, particularly when US market participants are active. Traders will also be watching whether price reacts sharply at the trendline and cloud area, since that zone is likely to define whether ETHUSDT enters a recovery attempt or resumes its downward path.
For now, ETHUSDT remains in a technically fragile position after losing trendline support. The next move will likely depend on whether price can reclaim that structure or confirm the breakdown with another leg lower.