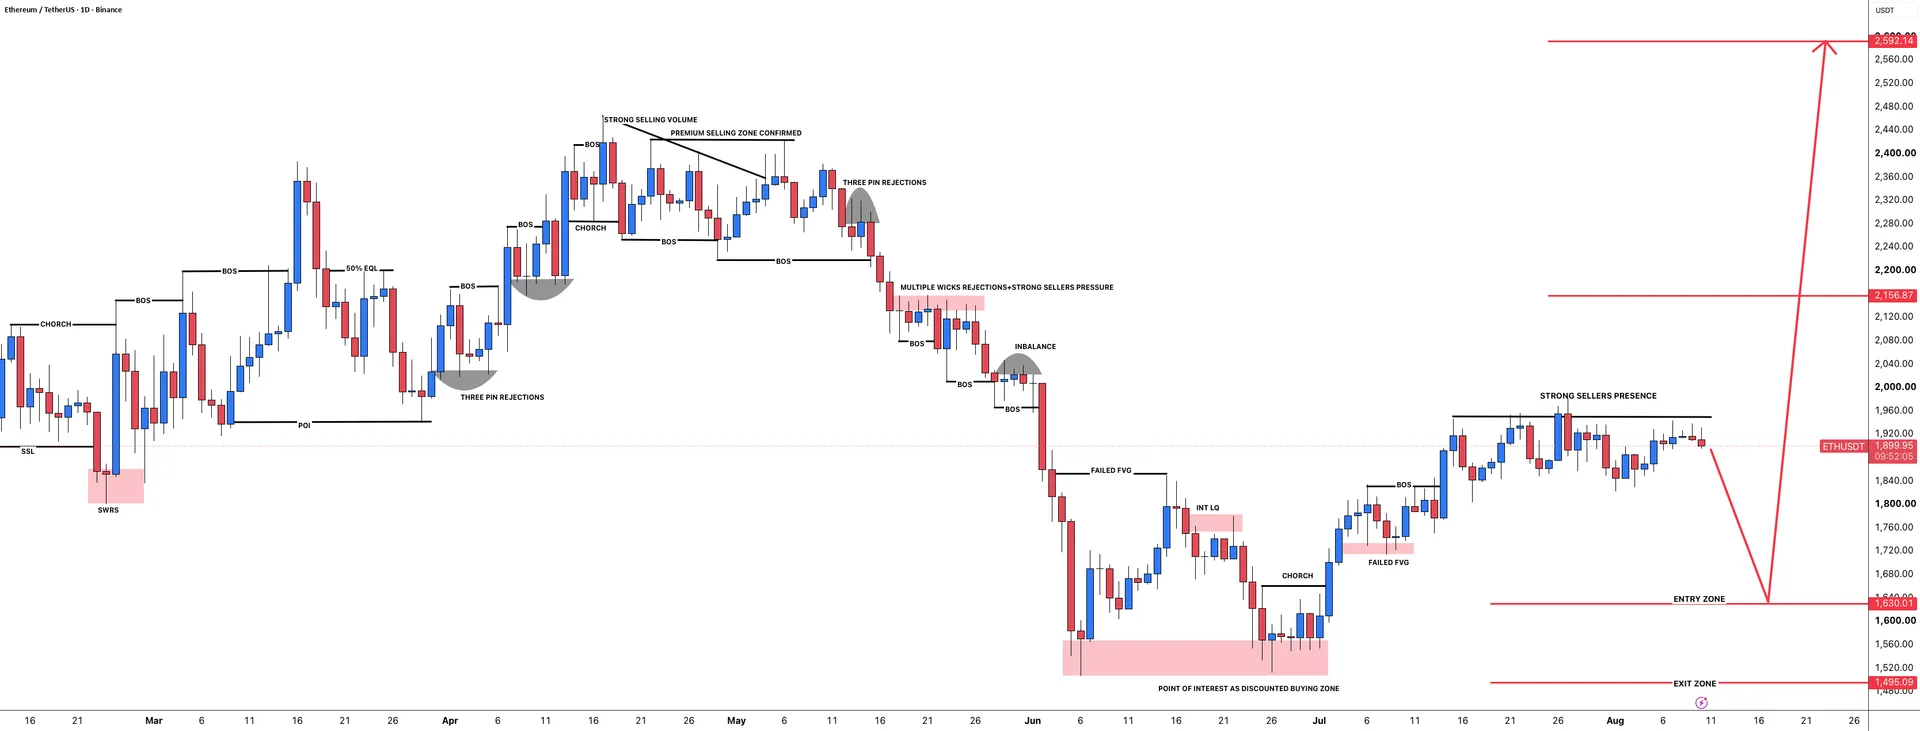
ETHUSDT remains in a neutral technical posture, with price action compressed between a well-defined demand zone and an important overhead resistance band. The key pattern on the chart is a potential breakout setup, with 1,940-1,960 standing out as the most important area to monitor.
For now, the market appears to be balancing between downside retest risk toward 1,630 and a possible upside expansion if buyers reclaim higher levels. That makes ETHUSDT a market where confirmation matters more than anticipation.
Market Snapshot
ETHUSDT is being assessed through a technical breakout framework, with the broader structure pointing to consolidation after prior directional movement. On this setup, price is trading between lower support near 1,630 and a cluster of resistance levels beginning at 1,940, creating a range where both continuation and rejection remain plausible.
In plain English, the prevailing bias is neutral because the chart does not yet show a decisive win for either buyers or sellers. A move above resistance would strengthen the case for upside continuation, while renewed weakness into support would keep the market trapped in a retest phase.
Key Levels
- Support: 1630, 1600, 1520
- Resistance: 1940, 1960, 2360, 2400, 2592
These levels matter because they mark prior reaction areas and likely zones of concentrated order flow. The 1,940-1,960 region is especially important as a breakout trigger area, while 1,630 and the broader 1,520-1,600 demand zone may define whether downside pressure remains corrective or becomes more significant.
Bullish Scenario
The bullish path for ETHUSDT would begin with a clear break and hold above the 1,940-1,960 resistance band. If that area is reclaimed with sustained momentum, it would suggest that buyers are regaining control and that the recent consolidation is resolving to the upside rather than acting as a ceiling.
From there, the next realistic upside zones would sit around 2,360 and 2,400, where price could encounter interim friction. If momentum remains strong beyond those barriers, the broader expansion target comes into view near 2,592, which stands out as the higher-end objective in the current structure.
Bearish Scenario
The bearish path remains valid as long as ETHUSDT cannot decisively clear 1,940-1,960. Continued rejection from that zone would keep the market vulnerable to another pullback, especially if broader crypto sentiment weakens or correlated risk assets lose momentum.
In that case, the first notable downside area is 1,630. A failure to stabilize there would shift focus to the 1,600 and 1,520 demand region, which serves as the more realistic lower target zone in this setup. From a structural standpoint, inability to reclaim resistance would act as the practical invalidation of the bullish breakout thesis.
What to Watch
The immediate focus is whether ETHUSDT can generate enough participation to challenge the 1,940-1,960 region with conviction. Breakouts are more reliable when they occur alongside expanding volume and broad market confirmation, so the character of any move into resistance may be as important as the level itself.
Macro conditions also matter. Traders will be watching economic releases that affect liquidity expectations, interest-rate sentiment, and overall appetite for risk assets. Crypto markets often respond quickly to shifts in the macro narrative, particularly when a technical setup is already near a decision point.
It is also worth monitoring Bitcoin, total crypto market sentiment, and volatility during major trading sessions. If correlated assets strengthen while ETHUSDT presses into resistance, the odds of upside follow-through can improve. If risk sentiment deteriorates, support levels near 1,630 and below may come back into play faster than expected.
ETHUSDT remains at a technically important junction, with both breakout and pullback scenarios still credible. The next sustained move will likely depend on how price behaves around resistance near 1,940-1,960 and support near 1,630.