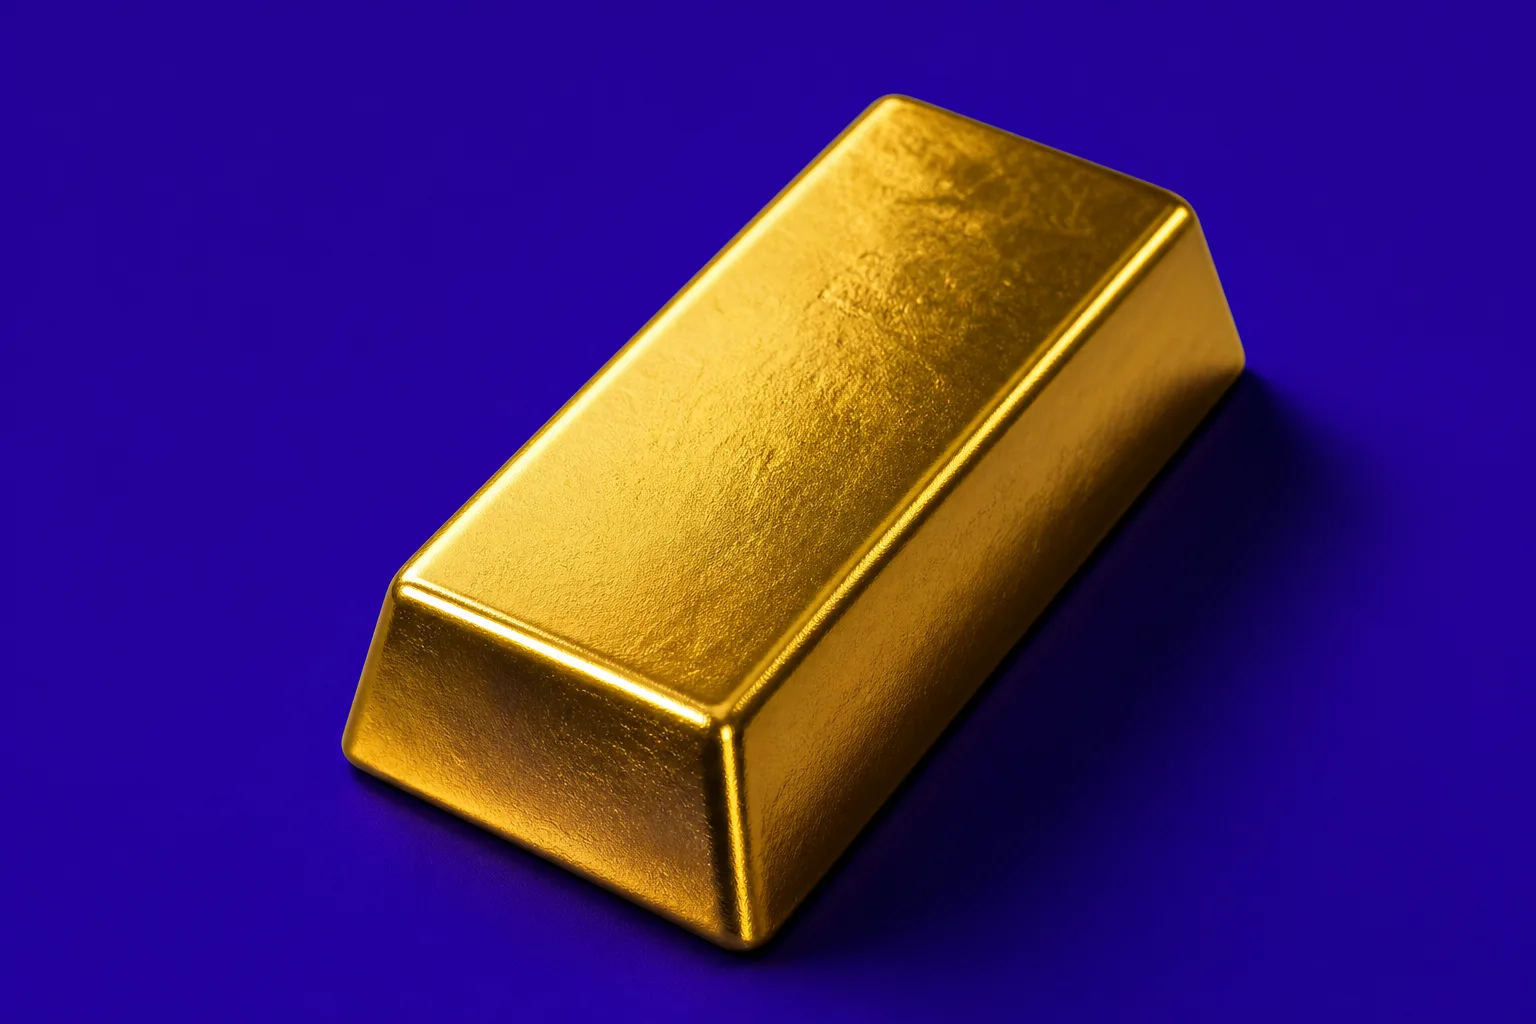
Gold prices pulled back in early U.S. trading on August 11, with spot bullion near $4,329.20 after a payroll-driven rally pushed the metal to its highest level since June 17. The retreat came as the dollar strengthened and Treasury yields edged higher, reversing part of Friday’s move.
The immediate catalyst for gold remains the U.S. interest-rate outlook. July payrolls fell by 23,000, while prior months were revised lower by a combined 103,000, cooling expectations for further Federal Reserve tightening and lifting bullion. But with the 10-year Treasury yield moving back toward 4.6%, the market is treating Wednesday’s July CPI release as the next decisive event.
The larger message for investors is that gold’s 2026 trading pattern has been shaped less by conflict headlines and more by real yields and the opportunity cost of holding a non-yielding asset.
Key Facts
- Spot gold traded near $4,329.20 on August 11, down 0.28% on the session after reaching a seven-week high on August 8.
- July nonfarm payrolls fell by 23,000, and revisions removed 103,000 jobs from the previous two months.
- The 10-year Treasury yield rebounded to about 4.666%, while the two-year yield traded near 4.226%.
- Gold remains about 22.6% below its January 29 record high of $5,595.42.
- Central banks bought 289 tonnes of gold in Q2 2026, the strongest second quarter in the historical series.
Gold Prices and Real Yields
The market action around gold has become increasingly mechanical. When rate-hike expectations drop, Treasury yields tend to fall, the dollar softens, and bullion benefits because its relative holding cost declines. That pattern was visible after the weak July labor report, which cut market-implied odds of a September Fed rate increase to roughly 44% from about two-thirds a week earlier.
Monday’s price action showed the other side of that trade. As the dollar regained some ground and benchmark yields rose, gold gave back part of Friday’s rally. The move suggests that the metal is still trapped in a macro-driven range rather than re-establishing a durable uptrend. Even so, repeated defenses above $4,300 indicate that buyers remain active on dips.
This matters because many investors still frame gold primarily as a geopolitical hedge. The 2026 price history argues otherwise. Gold hit an all-time high of $5,595.42 on January 29 and later fell to $4,053.11 by the end of July, even as Middle East tensions disrupted energy markets and pushed Brent crude toward $85. That decline is more consistent with rising real yields and a hawkish policy backdrop than with classic safe-haven demand.
“In 2026, gold has traded more like a real-yield asset than a war hedge.”
Why CPI matters more than conflict headlines
The next major test comes with July CPI on August 13 at 8:30 a.m. ET. Consensus points to headline inflation of 3.4%, down from 3.5% in June. If inflation cools as expected, the case for a September hike weakens, potentially pushing yields and the dollar lower again and giving gold room to challenge resistance in the $4,350 to $4,375 zone.
If CPI surprises to the upside, the opposite trade is likely. Higher inflation would revive tightening fears, pressure rate-sensitive assets, and raise the risk that gold retests lower support levels near $4,299, then $4,223. For now, the metal’s short-term direction appears tied far more closely to inflation data than to developments in the Strait of Hormuz.
Implications for Investors
For portfolio managers, the gold setup is balanced rather than one-sided. On the supportive side, central banks continue to provide a meaningful floor. Official-sector purchases reached 289 tonnes in the second quarter, up 62% from a year earlier, with Poland adding 51 tonnes and China adding 33 tonnes. That scale of buying helps explain why gold stabilized after its July trough near $4,053.
There is also evidence that physical demand remains resilient even as investment flows have weakened. Total gold demand, including over-the-counter activity, held steady at 1,269 tonnes in Q2, while first-half demand reached 2,522 tonnes with a record value of $380 billion. At the same time, recycled supply fell 6%, suggesting existing holders were reluctant to sell into lower prices.
Still, risks remain clear. Western ETF demand has not returned in force, and North American funds saw 61 tonnes of net outflows in the first half, the weakest start to a year since 2013. Jewelry demand also softened, falling 17% year over year in Q2 to 278 tonnes, with Chinese jewelry consumption dropping to its lowest level since 2005. That leaves gold dependent on central-bank buying, OTC accumulation, and macro relief from lower real yields rather than broad-based retail and institutional enthusiasm.
Investors should watch three variables closely this week: July CPI, the 10-year Treasury yield, and the U.S. 10-year TIPS real yield. A sustained move lower in real yields could support renewed ETF inflows and a push toward $4,500. If yields rise again, gold may remain range-bound despite strong official demand.
The near-term outlook for gold hinges on whether inflation data confirms the softer growth narrative implied by payrolls. Until then, bullion appears supported on pullbacks but still vulnerable to any rebound in real yields and the dollar.