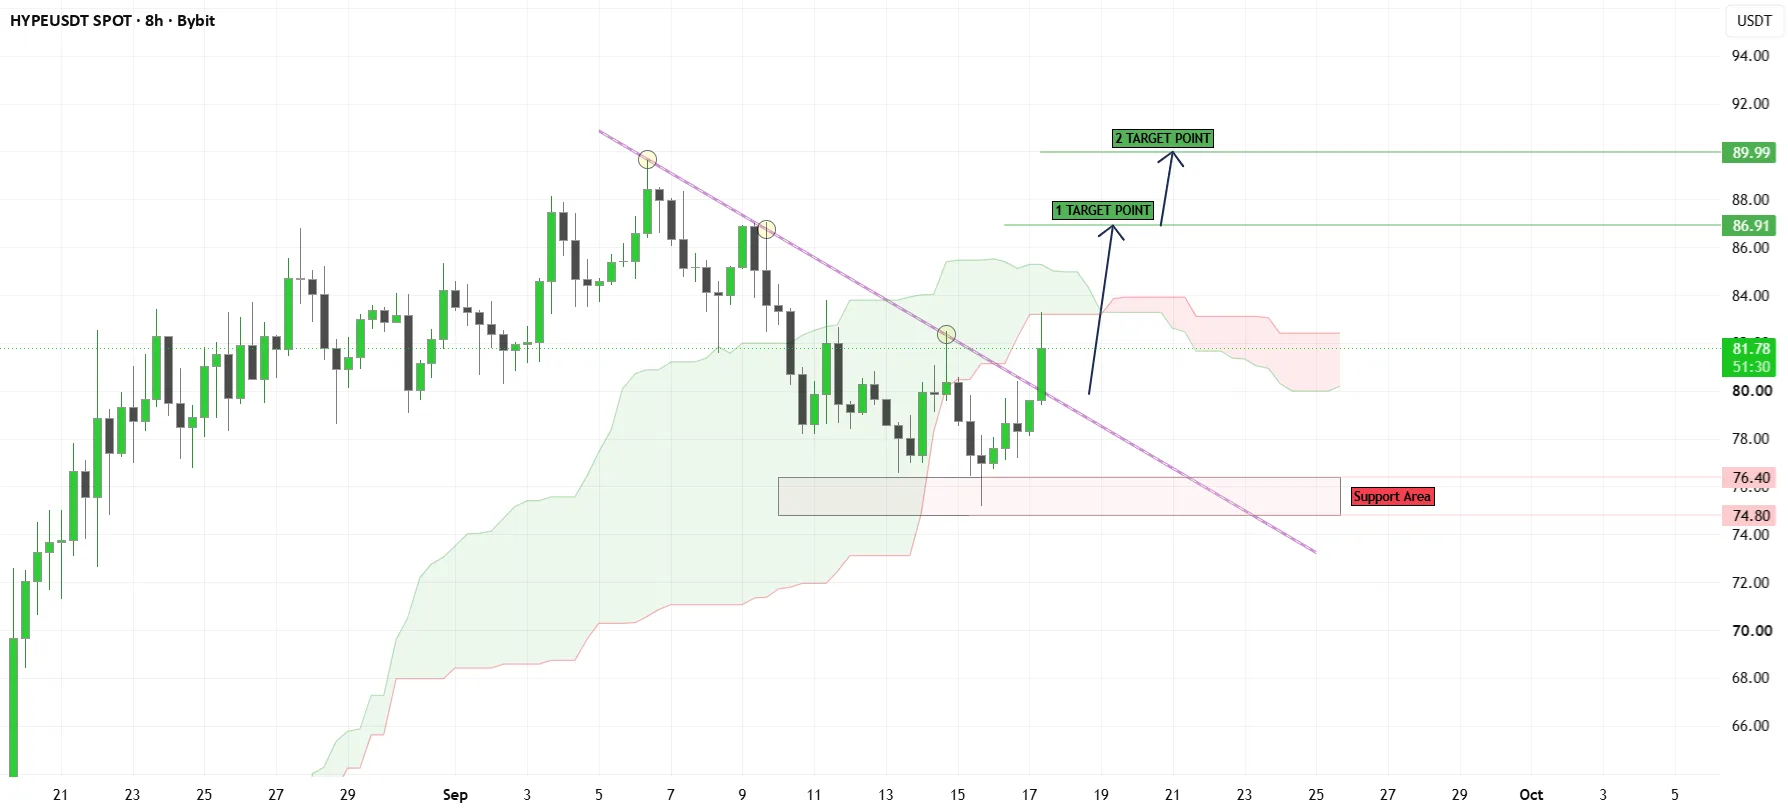
HYPEUSDT is holding a bullish technical bias after a breakout, with price now centered around a reclaimed support zone that could determine the next leg of the move. The most important area on the chart is the 74.8 to 76.4 band, which has shifted into focus as the market tests whether the breakout has staying power.
For now, the setup remains constructive as long as that structure continues to hold. If buyers defend the zone and preserve the higher-price structure, HYPEUSDT may have room for further upside expansion in the sessions ahead.
Market Snapshot
HYPEUSDT is a cryptocurrency pair currently showing a breakout-style structure on the chart. The broader technical picture points to a market that has pushed above a prior ceiling and is now attempting to convert that area into support, a common feature of trend continuation phases.
In plain English, the prevailing bias is bullish while price remains above the reclaimed base. The market is not simply rising in a straight line; instead, it is testing whether prior breakout momentum can be sustained through consolidation and support confirmation.
Key Levels
- Support: 74.8, 76.4
- Resistance: —
The 74.8 to 76.4 zone matters because it represents the structure that now underpins the bullish breakout thesis. When markets break higher and then hold above former reaction areas, that often signals that buyers are absorbing pullbacks rather than allowing the move to fully reverse. In this case, the absence of a clearly defined nearby resistance level also suggests that market participants may be watching price behavior, momentum, and order flow more closely than any single overhead barrier.
Bullish Scenario
The bullish path remains active if HYPEUSDT continues to hold above the reclaimed 74.8-76.4 support band. The key trigger for upside continuation is a stable defense of that area followed by renewed strength, which would indicate the breakout is being accepted rather than rejected. That kind of price action would keep the market structure constructive and support the case for trend extension.
In that scenario, a realistic target zone would be a push toward fresh local highs and then into price discovery above the recent breakout range. Without a defined resistance marker from the current setup, traders would likely monitor whether candles continue to close firmly above support and whether momentum expands as price revisits the highs. A sustained hold above the support band would be the clearest technical sign that buyers are still in control.
Bearish Scenario
The bearish path begins if HYPEUSDT loses the 74.8 to 76.4 zone on a sustained basis. That would weaken the breakout structure by showing that the reclaimed area is no longer functioning as support. Invalidation of the bullish setup does not necessarily require a dramatic collapse; even a clean break and failure to recover that band would be enough to shift the short-term technical tone.
If that breakdown develops, the market could rotate back into the prior trading region and search for a lower support base. A realistic downside target zone in that case would be the next area where buyers previously showed interest below 74.8, with the focus turning from continuation to retracement. The deeper price moves below the support band, the harder it becomes to argue that the breakout remains intact.
What to Watch
The first catalyst to monitor is session-based volatility. Crypto trades continuously, but liquidity conditions can still change meaningfully depending on whether Asian, European, or U.S. market hours are driving flows. If HYPEUSDT retests support during a higher-volume window, the market response there may carry more technical significance than a similar move in thinner conditions.
Broader crypto sentiment also matters. If large-cap digital assets such as Bitcoin and Ethereum remain stable or push higher, that can reinforce risk appetite across the altcoin complex and help support bullish continuation in pairs like HYPEUSDT. On the other hand, weakness in major crypto benchmarks could pressure momentum trades and make support retests more fragile.
Finally, traders may want to watch macro-sensitive sentiment indicators, including U.S. dollar direction, bond yield expectations, and any event that shifts appetite for speculative assets. While HYPEUSDT is trading on its own technical structure, breakout setups often perform best when the wider market environment is supportive and risk demand remains firm.
HYPEUSDT remains tilted to the upside while the 74.8 to 76.4 area holds as support. The next phase will likely depend on whether the market can confirm that reclaimed structure and convert the breakout into a sustained trend.