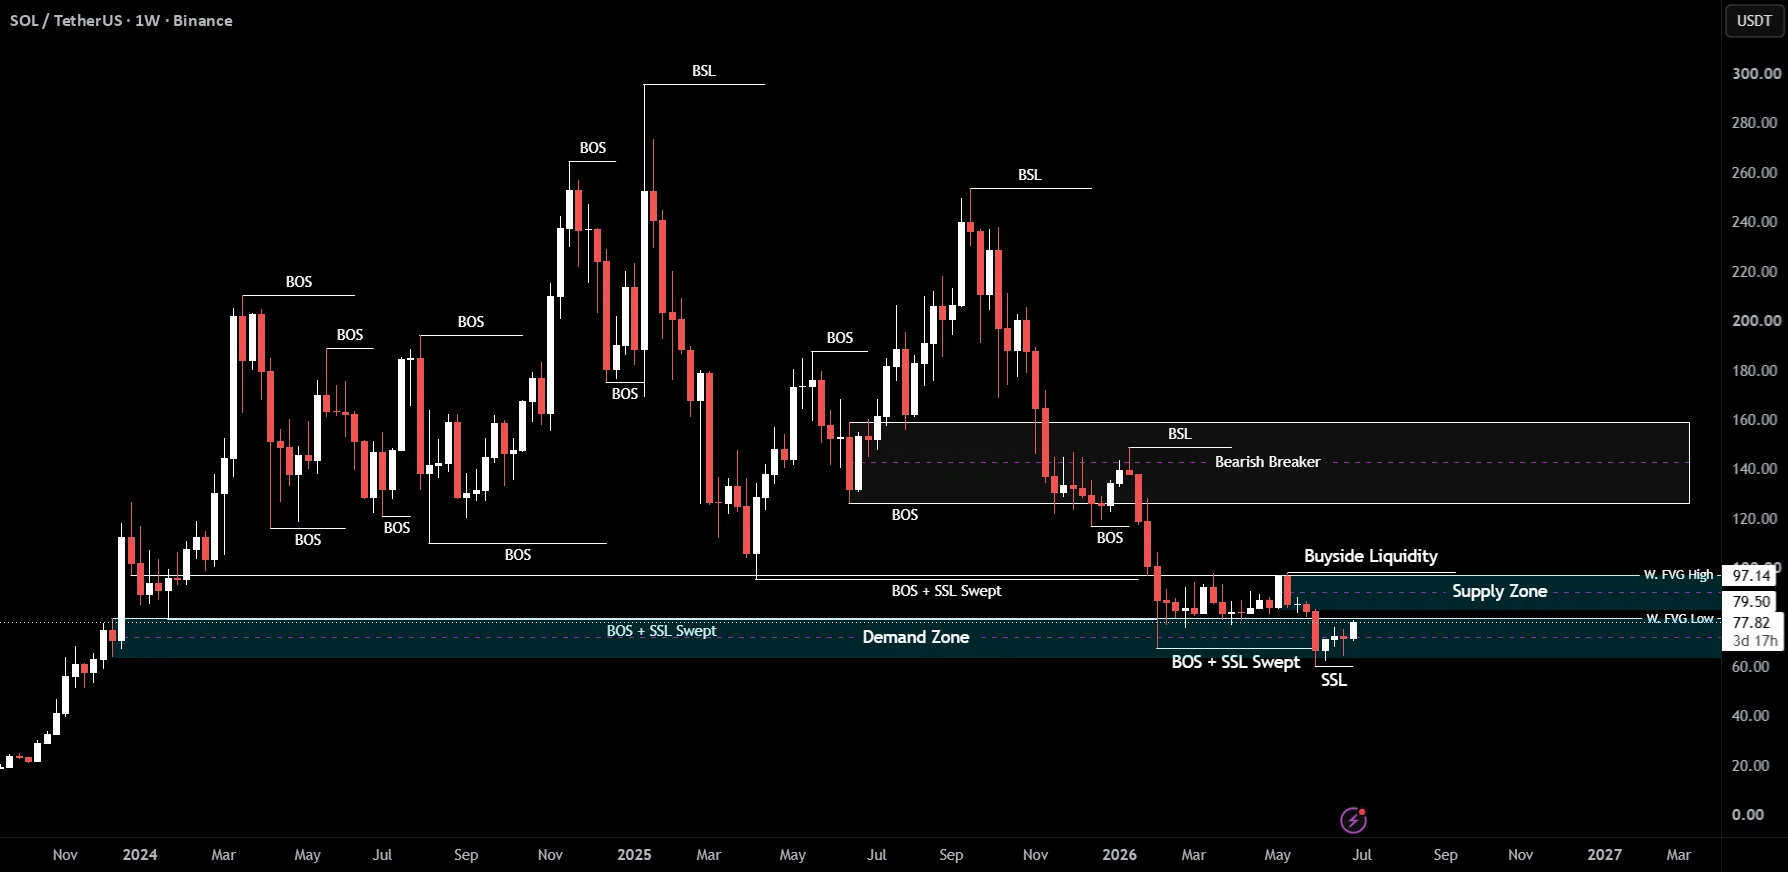
SOLUSDT is showing a bullish bias after reclaiming ground from a lower support area, with the recent liquidity sweep standing out as the most important technical development. That recovery has shifted attention back to 87.5, the level that now separates consolidation from a stronger continuation move.
For market participants tracking momentum in major crypto pairs, the next phase in SOLUSDT may depend on whether buyers can hold the recovery and convert resistance into support. A sustained push above 87.5 would strengthen the constructive outlook, while failure there could bring the lower support band back into focus.
Market Snapshot
SOLUSDT is a cryptocurrency pair currently presenting a constructive technical structure on the chart. The setup is defined by a rebound from lower levels following a liquidity sweep, a pattern that often appears when price briefly moves below support, clears out weak positioning, and then reverses back into the prior range.
In plain English, the market has recovered enough to keep the bullish case alive, but it has not yet fully confirmed a breakout. The prevailing bias remains positive while price holds above the recovery zone, with 87.5 acting as the main trigger that could decide whether the pair extends higher or stalls beneath overhead resistance.
Key Levels
- Support: 67.5, 60.13
- Resistance: 87.5, 100
These levels matter because they frame the current trading range and mark prior areas of reaction. Support near 67.5 and 60.13 represents zones where buyers previously stepped in, while 87.5 is the first major upside barrier. If momentum strengthens above that point, 100 becomes the next obvious area where profit-taking or fresh supply could emerge.
Bullish Scenario
The bullish path for SOLUSDT centers on a clean break above 87.5 followed by evidence that the market can hold that level on a retest. If buyers absorb supply there and price remains stable above the breakout zone, the chart would begin to favor a continuation move toward the 100 area.
That target is realistic because 100 aligns with the next visible resistance zone and a psychologically important round number. In this scenario, the liquidity sweep would look increasingly like a completed shakeout, with the recovery turning into a broader trend extension rather than just a short-lived bounce.
Bearish Scenario
The bearish alternative develops if SOLUSDT fails to sustain the rebound and loses the recovery structure after testing higher levels. A rejection near 87.5, especially if followed by a weak retest and renewed selling pressure, would suggest that the market is not ready to transition into a breakout phase.
In that case, the bullish setup would begin to weaken, and price could rotate back toward 67.5 as the first downside target. If that support fails to contain the decline, 60.13 becomes the next realistic zone to watch, as it marks a deeper level where demand would need to reappear to prevent a broader deterioration in structure.
What to Watch
Crypto traders should monitor broader market sentiment as SOLUSDT often responds to moves in Bitcoin and Ethereum, particularly during periods of elevated volatility. If leading digital assets are firm and risk appetite improves across the sector, Solana may find the support needed to challenge overhead resistance.
Macro conditions also matter, even for crypto-specific setups. Inflation data, central bank commentary, and shifts in rate expectations can influence the dollar, real yields, and overall demand for risk-sensitive assets. A supportive macro backdrop tends to help bullish continuation patterns, while a risk-off turn can undermine breakout attempts.
Session timing is another factor worth tracking. Breakouts that occur during periods of stronger global participation and higher volume tend to carry more credibility than moves that develop in thin trading conditions. Sentiment indicators, derivatives positioning, and the market’s reaction at 87.5 should provide useful clues about whether momentum is building or fading.
SOLUSDT remains at an important technical inflection point, with the bullish bias intact but not fully confirmed. The next decisive move around 87.5 should help clarify whether price is preparing for an advance toward 100 or a pullback into lower support.