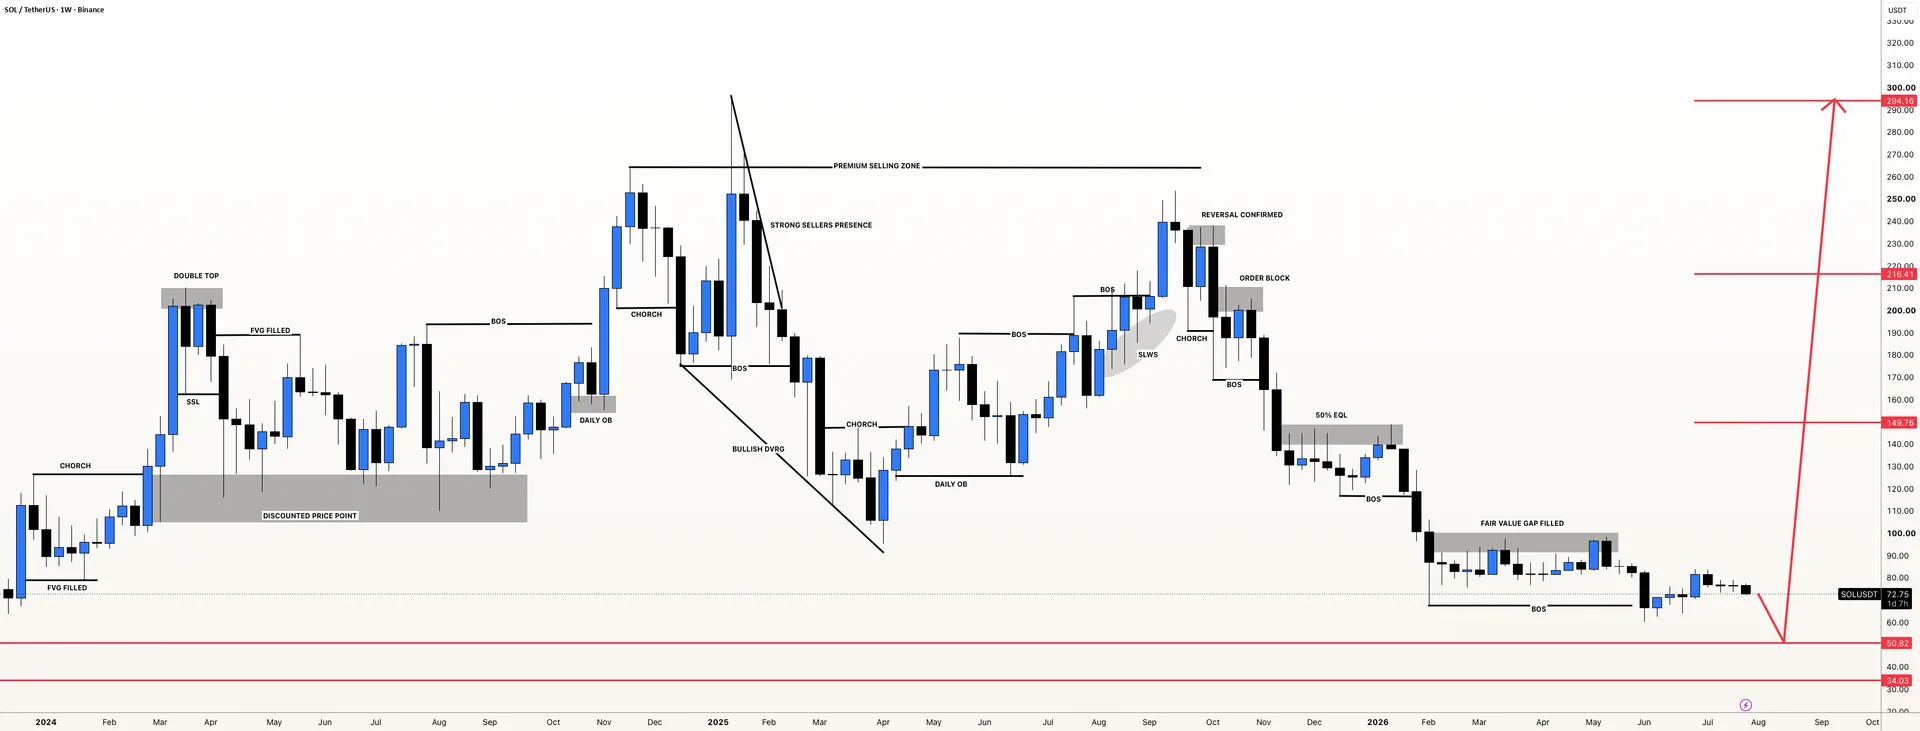
SOLUSDT is trading with a bullish medium-term bias, but the main focus is on whether price can stabilize in the 50 to 40 support zone. That area stands out as the most important level on the chart because it may define whether a broader reversal can take shape.
The core technical idea is straightforward: if SOLUSDT attracts buyers in that lower band, the market could begin rebuilding momentum toward 264. Until that happens, traders are likely to keep watching for confirmation that support is being defended rather than broken.
Market Snapshot
SOLUSDT is a crypto pair being assessed through a reversal lens, with the current structure centered on a pullback into major support. The broader bias remains constructive, but the market appears to need a deeper test of demand before any sustained upside continuation can develop.
In plain English, the chart suggests that weakness into the 50 to 40 region may not automatically damage the bullish case. Instead, that zone could become the platform for a recovery move if price action begins to show a base, reduced selling pressure, and stronger reactions off support.
Key Levels
- Support: 50, 40
- Resistance: 264
These levels matter because the 50 to 40 area represents the proposed buying zone tied to the reversal thesis, while 264 marks the major upside objective and a historically important resistance area. In technical terms, such zones often attract attention because they can combine prior reaction points, sentiment shifts, and momentum inflection.
Bullish Scenario
The bullish path depends on SOLUSDT holding the 50 to 40 support band and showing evidence of reversal from that region. A trigger would likely come from a firm rejection of lower prices, a sequence of higher lows on the lower timeframes, or a decisive recovery back above nearby short-term structure after the support test is complete.
If that process unfolds cleanly, the market could begin a broader rebound targeting higher resistance levels over time, with 264 standing out as the main target zone. Reaching that level would likely require improving risk appetite across crypto, steady momentum, and confirmation that the support base is attracting sustained demand rather than only short-covering.
Bearish Scenario
The bearish path is not necessarily a collapse narrative, but rather an extension of the current decline into the anticipated support area. In this view, SOLUSDT could continue sliding toward 50 and potentially 40 before any meaningful reversal attempt begins.
The bullish setup would become more fragile if price fails to stabilize in that zone or starts closing decisively below 40, which would act as an invalidation area for the current reversal thesis. If support gives way, the market could shift from accumulation expectations to a deeper corrective phase, delaying any move toward 264 and forcing traders to reassess the larger structure.
What to Watch
The first catalyst is overall crypto market tone. SOLUSDT rarely trades in complete isolation, so direction in Bitcoin, Ethereum, and broader altcoin sentiment can influence whether buyers are willing to defend the 50 to 40 region aggressively. If large-cap crypto remains stable or strengthens, the probability of a cleaner reversal in SOLUSDT may improve.
Macro conditions also matter. Interest-rate expectations, inflation data, and shifts in global risk sentiment can affect flows into higher-volatility assets such as cryptocurrencies. Even when the chart setup is clear, external pressure from a stronger dollar or a broad risk-off move can interrupt a developing rebound.
Session timing is another factor worth monitoring. Crypto trades around the clock, but volatility often increases when major US and European market participants are active. A sharp reaction into support during high-liquidity hours, especially if accompanied by rising volume and improving sentiment across correlated assets, could offer better confirmation that the reversal structure is gaining credibility.
For now, SOLUSDT remains a market defined by a bullish bias but conditional support behavior. The next phase will likely depend on whether the 50 to 40 zone can hold and convert current weakness into a more durable recovery structure.