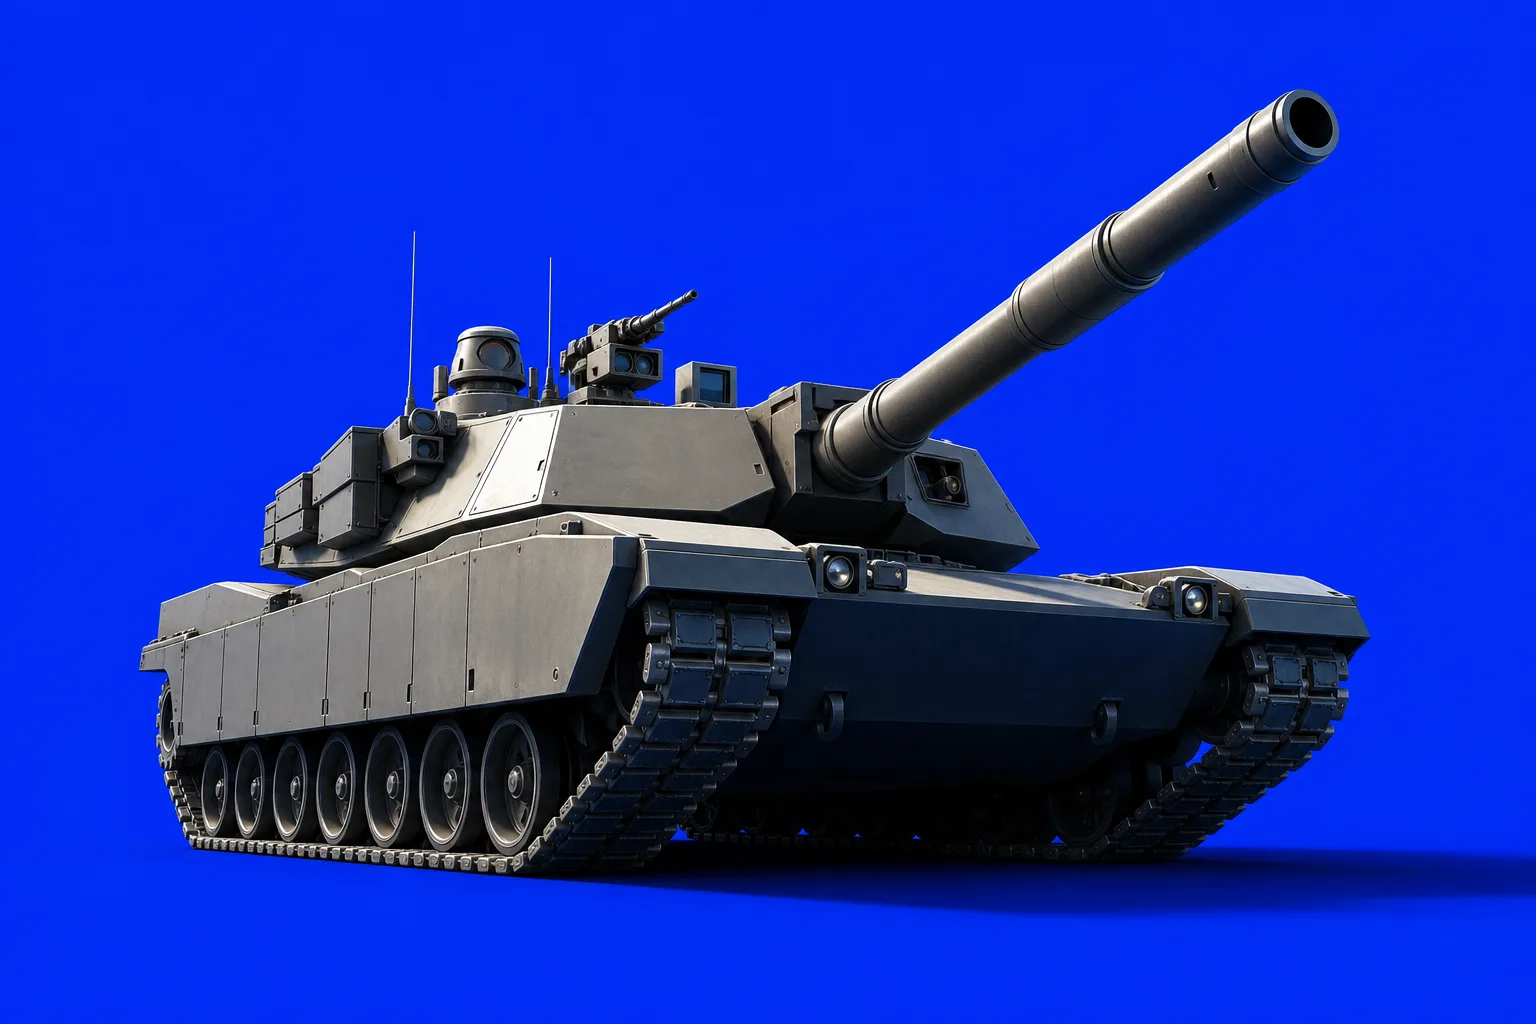
U.S. defense R&D spending stands far above every other OECD economy, reaching $3.64 per $1,000 of GDP in the latest cross-country comparison. That is nearly 1.8 times South Korea’s level and well ahead of the United Kingdom, Germany, and France.
The spending gap matters beyond military budgets. Defense research funding influences demand for aerospace systems, semiconductors, communications networks, cyber capabilities, advanced materials, and dual-use technologies that can spill into civilian markets.
The divergence may widen again in fiscal 2027. The U.S. administration’s proposed defense budget totals $1.5 trillion, with defense R&D rising from $16.6 billion in 2026 to $18.7 billion in 2027, reinforcing the country’s leadership in military innovation.
Key Facts
- The United States allocated $3.64 in defense R&D per $1,000 of GDP, the highest among the 20 OECD countries ranked.
- South Korea ranked second at $2.06 per $1,000 of GDP, while the United Kingdom placed third at $0.97.
- Germany and France ranked fourth and fifth at $0.79 and $0.50 per $1,000 of GDP, respectively.
- The average across the 20-country group was $0.58, while the median was only $0.27, showing how heavily the top spenders skew the field.
- The proposed U.S. fiscal 2027 defense budget is $1.5 trillion, and planned defense R&D would increase to $18.7 billion from $16.6 billion in 2026.
U.S. Defense R&D Spending
The OECD comparison highlights how concentrated defense innovation spending has become. On a GDP-adjusted basis, the U.S. spends not just more than its allies, but substantially more. Its $3.64 figure is more than 3.7 times the United Kingdom’s level and more than seven times France’s. At the bottom of the ranking, Greece allocated just $0.09 per $1,000 of GDP.
That spread reflects different national priorities. Some countries direct more of their defense budgets toward procurement, troop readiness, or operating costs rather than early-stage research. The U.S., by contrast, continues to fund a broad research base spanning weapons systems, aerospace platforms, autonomous technologies, cyber tools, space infrastructure, and foundational science.
For investors, this matters because defense R&D is often the first signal of future procurement cycles. Research budgets do not convert directly into near-term revenue, but they help identify where governments expect to build strategic capability over the next decade. Companies tied to missiles, next-generation aircraft, drones, sensors, software-defined warfare, secure communications, and satellite systems may all benefit from this long pipeline of public funding.
The United States is not just leading in defense R&D intensity; it is operating on a different scale from most of the OECD.
Why South Korea and Europe Still Matter
South Korea’s second-place ranking at $2.06 per $1,000 of GDP stands out because it is the only other country above the $2 threshold. The country’s defense industrial base has expanded rapidly, and its role in global arms exports has grown with it. Four South Korean companies appeared in the list of the world’s top 100 arms producers by sales in 2024, and their combined revenue rose 30% from 2023.
Europe’s picture is more mixed. The United Kingdom’s rise to $0.97 per $1,000 of GDP reflects a marked increase in research commitment, with Ministry of Defence R&D expenditure climbing from £1.02 billion in 2019 to £3.07 billion in 2024. Germany and France remain key continental players, but their lower ratios suggest Europe still trails the U.S. in turning economic scale into defense research intensity.
Implications for Investors
The clearest market implication is that sustained defense R&D spending supports a long-duration growth thesis for defense primes and specialized suppliers. Firms with exposure to classified systems, advanced electronics, propulsion, simulation, space assets, and cyber defense could see stronger program visibility if budget proposals translate into enacted appropriations. The U.S. remains the central market, but South Korean manufacturers are increasingly relevant in global competition.
Investors should also watch the difference between research spending and production spending. A larger R&D budget can create future contract opportunities, but revenues may arrive unevenly and depend on testing milestones, procurement approvals, export controls, and political negotiations. In practical terms, early-stage technology winners are not always the same companies that dominate scaled manufacturing later.
Another important angle is dual-use innovation. Historically, defense research has helped drive breakthroughs in computing, aerospace, satellites, medicine, and advanced materials. That creates potential upside not only for traditional defense contractors but also for industrial, semiconductor, software, and communications companies whose technologies can be adapted for military use. At the same time, secrecy requirements can limit commercial spillovers, making stock selection more dependent on program exposure and customer concentration.
Budget risk remains real. The proposed $1.5 trillion U.S. defense budget for fiscal 2027 would represent a 42% increase over 2026 funding, but proposals can change during the appropriations process. Investors should monitor final congressional outcomes, shifts in threat assessments, allied burden-sharing, and whether NATO and Indo-Pacific partners raise their own R&D commitments in response.
If current trajectories hold, defense R&D will remain a powerful driver of capital allocation across aerospace, security, and frontier technology. The next phase for markets is not whether governments will keep spending, but which technologies and contractors capture the most durable share of that spending.