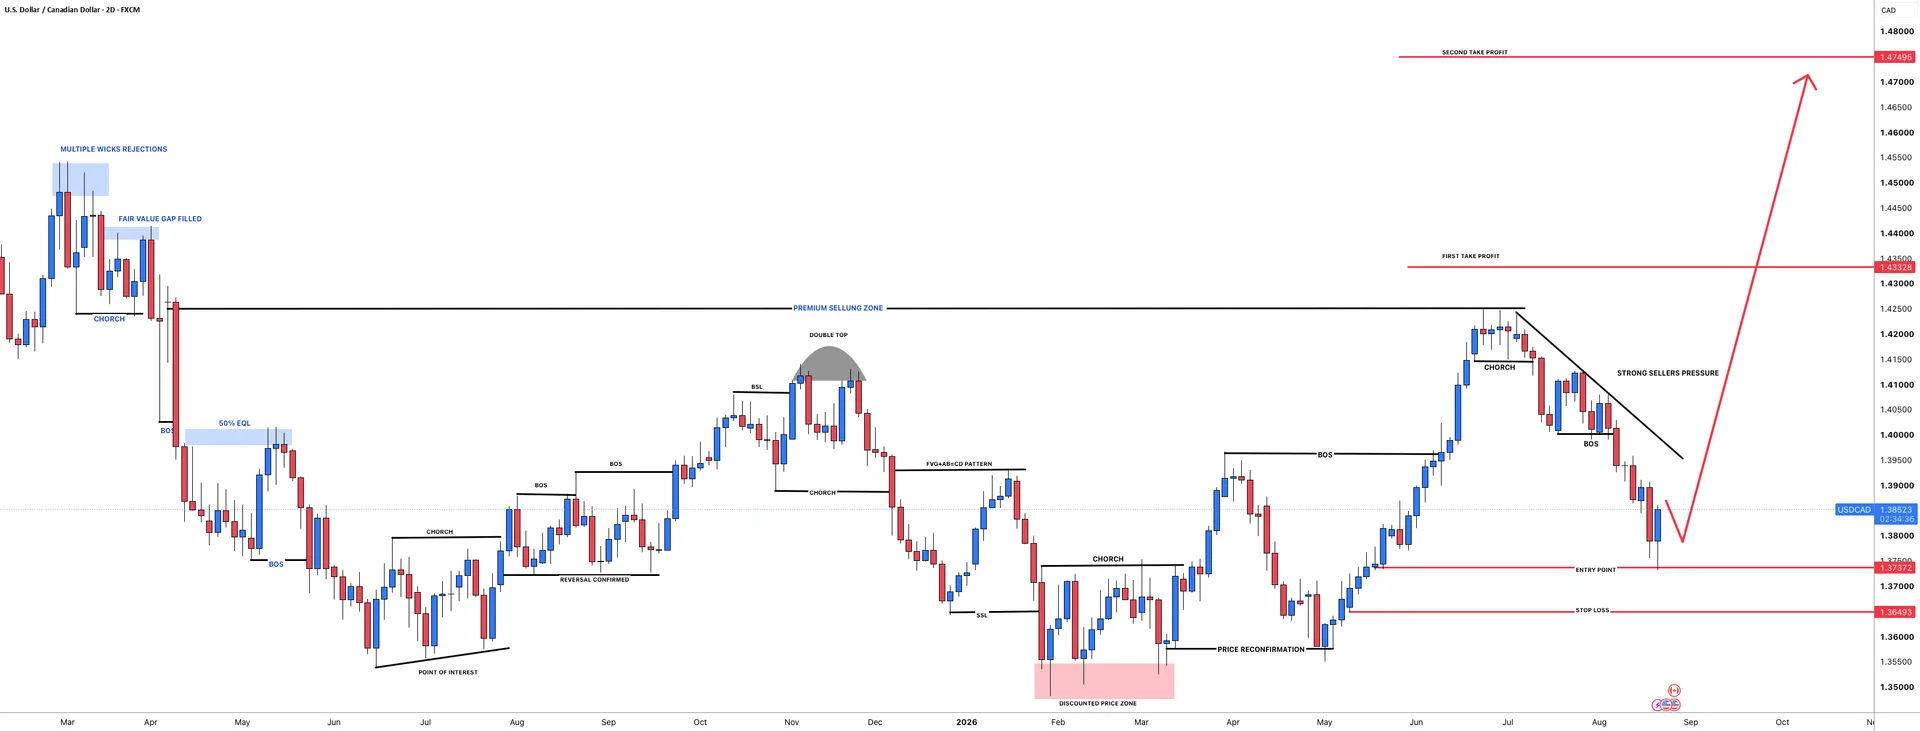
USDCAD is showing a bullish bias as price tests a higher-timeframe demand area, with 1.38545 standing out as the most important support level on the chart.
The setup is notable because the pair is attempting a bullish reversal from a discounted zone, creating a technical framework where upside continuation becomes more credible if buyers regain short-term control.
Market Snapshot
USDCAD is a forex pair being viewed through a technical lens that favors a recovery scenario after a corrective phase. The current structure suggests that while short-term selling pressure has weighed on price, the broader chart is still respecting a higher-timeframe demand zone.
In plain English, the market appears to be pulling back within a larger bullish framework rather than breaking down outright. As long as the pair remains supported above the key floor, the prevailing bias stays constructive and the focus remains on whether momentum can rebuild toward overhead resistance.
Key Levels
- Support: 1.38545
- Resistance: 1.43328, 1.47495
These levels matter because they define the current trading map. Support at 1.38545 marks the area where buyers are expected to defend the broader reversal idea, while 1.43328 and 1.47495 represent likely reaction zones based on prior structure and the path of a potential continuation move.
Bullish Scenario
The bullish case remains centered on a reversal from the higher-timeframe demand zone. If USDCAD continues to stabilize above 1.38545 and starts printing stronger recovery candles, the first meaningful upside trigger would be a move that confirms buyers are regaining control of the recent correction.
From there, 1.43328 becomes the first realistic target zone, as it is the nearest major resistance level. If bullish momentum remains intact beyond that area, the next upside objective shifts toward 1.47495, which would represent a broader extension of the reversal pattern and a test of higher resistance within the wider trend structure.
Bearish Scenario
The bearish path does not necessarily invalidate the broader recovery idea immediately, but it would suggest that short-term sellers still dominate the pair. Continued weakness while price trades back into the discounted buying area would indicate that the market is not yet ready to transition from correction to sustained rebound.
A decisive break below 1.38545 would serve as the key invalidation level for the bullish setup. If that support fails, USDCAD could remain under pressure and extend lower in search of a deeper value area, delaying any move toward 1.43328 and forcing market participants to reassess whether the higher-timeframe demand zone is still holding.
What to Watch
Traders following USDCAD will want to monitor macroeconomic catalysts tied to both the U.S. dollar and the Canadian dollar. Economic releases involving inflation, labor market data, central bank expectations, and growth trends can quickly influence direction, especially when the pair is sitting near an important technical inflection point.
Session timing also matters. Volatility in USDCAD often increases during North American trading hours, when liquidity improves and the market reacts more fully to data from the United States and Canada. A break or rejection near 1.38545 during that period could carry greater significance than a similar move in thinner conditions.
Correlated assets and broader sentiment are also worth tracking. Crude oil can influence the Canadian dollar, while broad U.S. dollar strength or weakness may shape how quickly USDCAD approaches either resistance or support. If risk sentiment shifts sharply, that change could either reinforce the bullish reversal structure or prolong the corrective phase.
For now, USDCAD remains at a technically important juncture where support and structure are closely aligned. The next directional clue will likely come from how price behaves around 1.38545 and whether buyers can convert that zone into a sustained push toward resistance.